meanbean3.html
Mean Beans
Introduction:
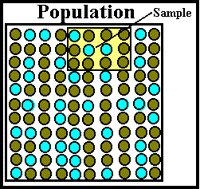 On type of scientific investigation involves the determination of the different types of individuals within a population. An example being: What percent of the people in Temple Texas have blue eyes? The most accurate method to determine this would be to contact every person in Temple and record their eye color. But this would take too long, cost too much, and be hard to do. The best alternative method would be that of sampling. In sampling, only a small section of the population is analyzed such as 100 people. This small sample of 100 people is suppose to represent the whole population of Temple. But care must be taken in determining which 100 people to record. By sampling only one neighborhood only one ethenic group might be recorded and the results would be biased. The choosing of the 100 people must be done at random with any one person in Temple having the same chance of being chosen as any other. One way could be by using the phone book and selecting a person from each page at random. Another way might be by recording the eye color of some of the students at the highschool. Can you think of another way? Remember that the choosing must always be done by random sampling.
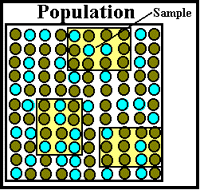 This exercise involves the sampling of two (or more) colors of beans to determine the percent of each color. Also included in this lesson is the concept that repeated sampling increases the reliability of the results.
This is not only true for sampling but also for any kind of scientific investigation. Reliability of results is increased by repeated investigations.
Materials:
- Bag of beans
- Red spray paint
- Plastic cups
- Small box
- Data chart
Procedure:
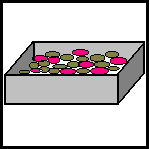 1. Take 500 beans and spray paint 200 of them red and let them dry.
2. Place all 500 beans in a box.
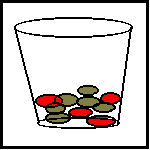 3. Let each group of students select a sample of 10 beans from the box without veiwing the beans.
4. Students should place the selected beans in a plastic cup which each group should have.
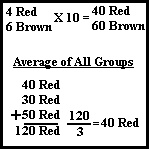 5. Each group should determine from their sample of ten how many red beans would be in every 100 in the box (population). This is done by countin the number of red beans and multiplying the count by 10.
6. All groups then will share their data and the average number of red beans per onehundred will be calculated for all groups
7. The groups should then compare their group number of red beans per onehundred to that of the class average.
8. The instructor should then reveal the true number of red beans in the box and compare it to the numbers obtained by sampling.
9. Each group should write a report on how this investigation prove that many samples are more accurate than just one sample.
Evaluation:
This acivity can easily be evaluated by the use of a Rubric.
- 25 points - Did the students follow instructions?
- 25 points - Did the students share in the investigation?
- 25 points - Did the students correctly compile the data and calculations?
- 25 points - Did the students write a valid report ?
Extensions:
This investigation can be altered to include multiple colors of beans.
 On type of scientific investigation involves the determination of the different types of individuals within a population. An example being: What percent of the people in Temple Texas have blue eyes? The most accurate method to determine this would be to contact every person in Temple and record their eye color. But this would take too long, cost too much, and be hard to do. The best alternative method would be that of sampling. In sampling, only a small section of the population is analyzed such as 100 people. This small sample of 100 people is suppose to represent the whole population of Temple. But care must be taken in determining which 100 people to record. By sampling only one neighborhood only one ethenic group might be recorded and the results would be biased. The choosing of the 100 people must be done at random with any one person in Temple having the same chance of being chosen as any other. One way could be by using the phone book and selecting a person from each page at random. Another way might be by recording the eye color of some of the students at the highschool. Can you think of another way? Remember that the choosing must always be done by random sampling.
 This exercise involves the sampling of two (or more) colors of beans to determine the percent of each color. Also included in this lesson is the concept that repeated sampling increases the reliability of the results.
This is not only true for sampling but also for any kind of scientific investigation. Reliability of results is increased by repeated investigations.
 1. Take 500 beans and spray paint 200 of them red and let them dry.
 3. Let each group of students select a sample of 10 beans from the box without veiwing the beans.
 5. Each group should determine from their sample of ten how many red beans would be in every 100 in the box (population). This is done by countin the number of red beans and multiplying the count by 10.